Why does my PivotTable not pick up all the column headings from payroll? #
This is likely due to not selecting all the data columns; for example, if you have added some pay definitions since you first created the report or are using more Shift Pay Items, the number of columns in the underlying data will increase.
In Excel:
- Click anywhere in the PivotTable
- Menu Pivot Table Analyse > Change Data Source and carefully modify the Location to include the last column of data:

Why is my PivotTable missing data? #
Have you redone the pay run of interest?
Have you run Analytics and included the full date range needed?
- Check and Note the last Excel column of data in the analytics file above.
- Then click in the pivot table, if you go to Pivot Table Analyse > Change data source, does it include columns up to the last column?
- Have you done a Data > Refresh all in Excel
- Have you checked that all Excel PivotTable filters do not hide any needed data?
How do I analyse shifts or overtime? #
By default, every Pay Definition which is selected according to the “Setup -> Report Definition” you are using (commonly “Finance Journal”), ends up with a separate column in the data, :
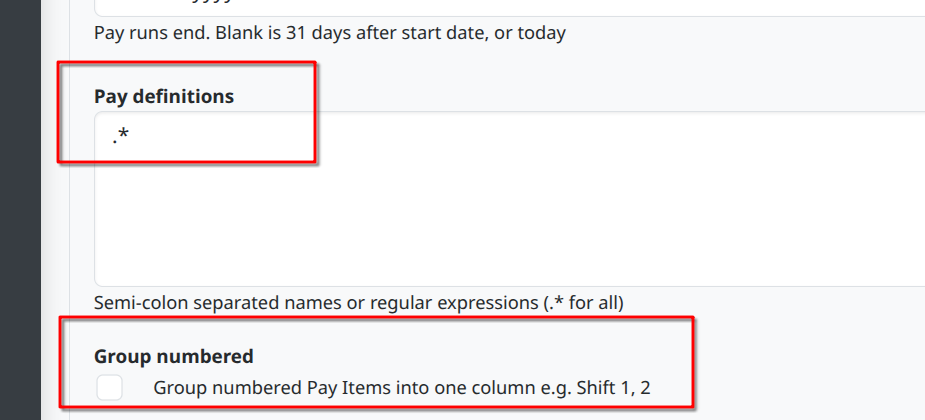
This can be unwieldy when handling multiple shifts like “Shift 1”, “Shift 2”, “Shift 3” or multiple overtimes like “Overtime x1.5 1”, “Overtime x1.5 2”, “Overtime x1.5 3”. So, if you tick the “Group numbered” setting, each group will be collapsed into one column, which can make the analysis easier.
Cost to employer #
If you further need to analyse the costs involved, the 2026-02 release has a new column in the Analytics report called “Cost to employer”. By default, this is the sum of all the Pay Item outputs which result in a cost to the employer. If needed, this can be combined with the above to create a notional breakdown by Shifts, Overtime x1, Overtime x1.5 etc.